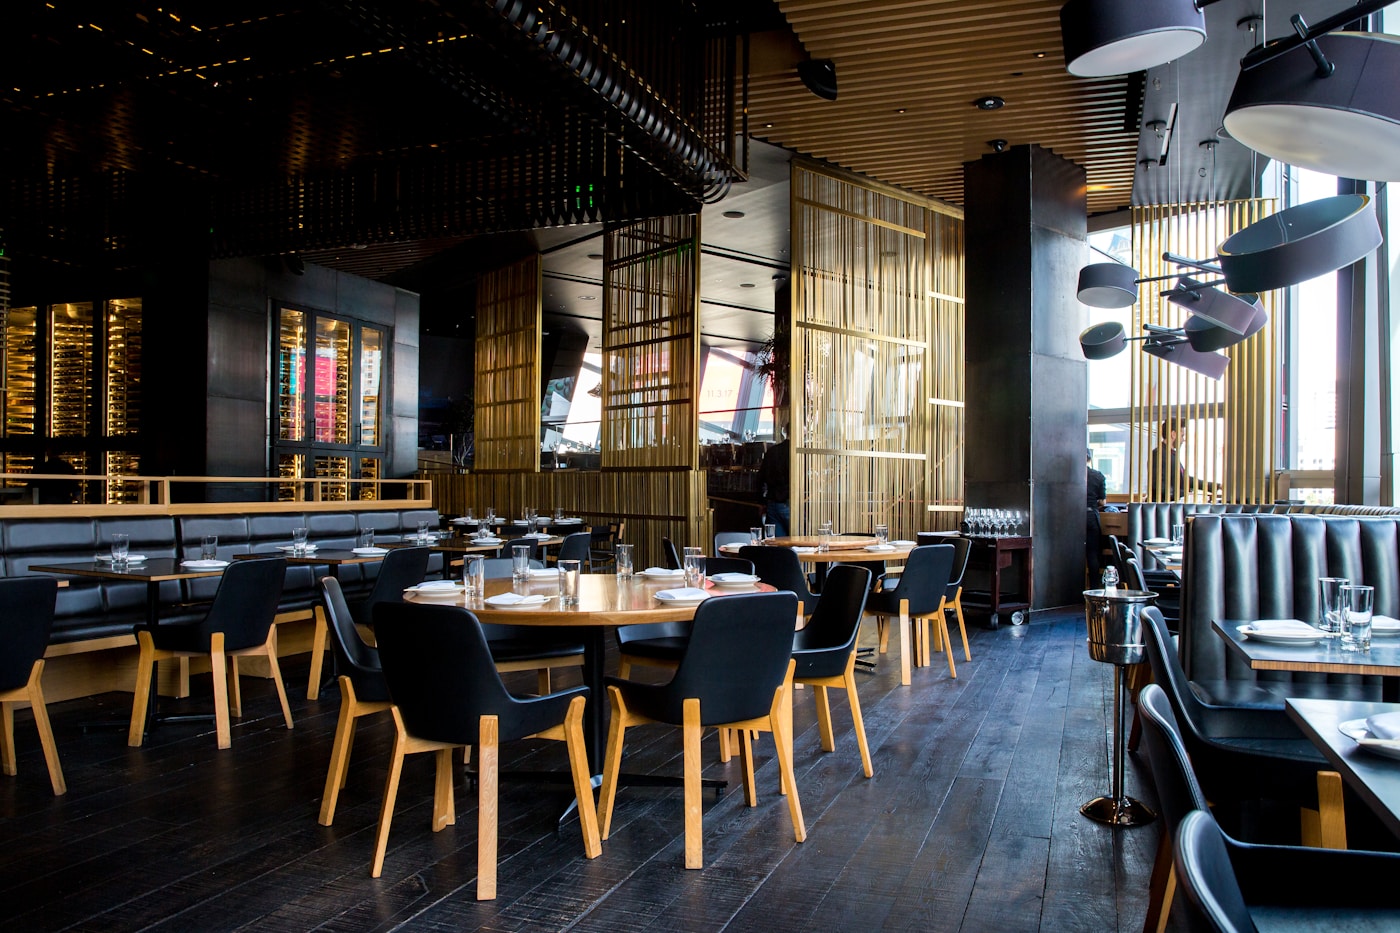
Tock sells reservation and experience software to restaurants and hospitality operators. iExcel rebuilt the measurement spine, then the paid engine — and cut cost-per-demo 63% in one month.
Tock's buyer isn't a casual diner. It's a sommelier, a GM, a hospitality group COO. Sales cycles are deliberate. Onboarding requires trust. A demo request is the first real signal of intent — and every one of them has to be earned.
When iExcel came in, the surface looked busy. Google Ads were running. LinkedIn was running. Forms were submitting. But underneath — the measurement spine that ties campaigns to demos to closed customers wasn't there yet. You can't optimize what you can't trust.
So we did it in two phases. First, build the foundation. Then, turn the engine on.

Most agencies start with the ad account. We started one layer deeper — with HubSpot, Salesforce, and the question every marketing leader needs answered before they spend another dollar: which demos are real, and where did they come from?
The implementation everything else depends on. Lifecycle stages defined. Sales handoff mapped. Attribution wired.
With the spine in place, we turned the channels. Audit, restructure, test, scale. Then verify every conversion was real.

"The buyer is busy running a restaurant. Your one shot is a clean, fast, trustworthy demo request — and a measurement layer that proves it converted."
December 2023 was the inefficiency peak. Cost-per-demo on Google Search had drifted to the worst month on the program's books — the kind of number a paid account earns when it's spending against everything instead of what converts. So we pulled the budget back, restructured the search account around the campaigns that were actually producing demos, and shipped a tighter spend plan into January.
The result was the kind of month every paid lead asks for and rarely sees: against the program's own December baseline, spend fell 56%, demo requests rose 18%, and cost-per-demo dropped 63% — in a single monthly cycle. Not by cutting the volume. By cutting the waste.
The reset proved the search account could be efficient. February proved it could scale without sacrificing the efficiency. Spend came back up 47% month-over-month, demo requests rose 54% — and cost-per-demo still fell another 4.6%. Spend up and cost-per-lead down in the same month is the combination most paid programs never print; it only happens when the account structure is doing the work, not the budget.
The biggest unlock was the competitor campaign. In January it had been the least efficient line in the entire account. In February — restructured, retargeted, refined — its cost-per-demo came down roughly 85% against its own January baseline, from the worst unit economics in the test matrix to among the best.
Broad-match testing on the non-brand reservation-software campaign hit at the same time: demo requests up 124% at a 10% lower cost-per-demo. The kind of result that doesn't come from "more spend." It comes from a better account.

March pulled cost-per-demo down another 13.2% — the third consecutive monthly decline, stacking to roughly 70% below the December baseline — while demo volume held near its February peak. The US non-brand competitor line kept improving too: demo volume more than 2× the prior month, at a lower cost-per-demo.
Paid social read cleanly against the same yardstick. Meta was the early efficiency winner — the lowest cost-per-conversion of any paid channel in January, with a 7.6% form-view-to-submission rate on the Experience Playbook campaign. LinkedIn drove reach at seven-figure monthly impression volume but needed budget consolidation to optimize properly. We flagged it, structured the recommendation, and handed it off.
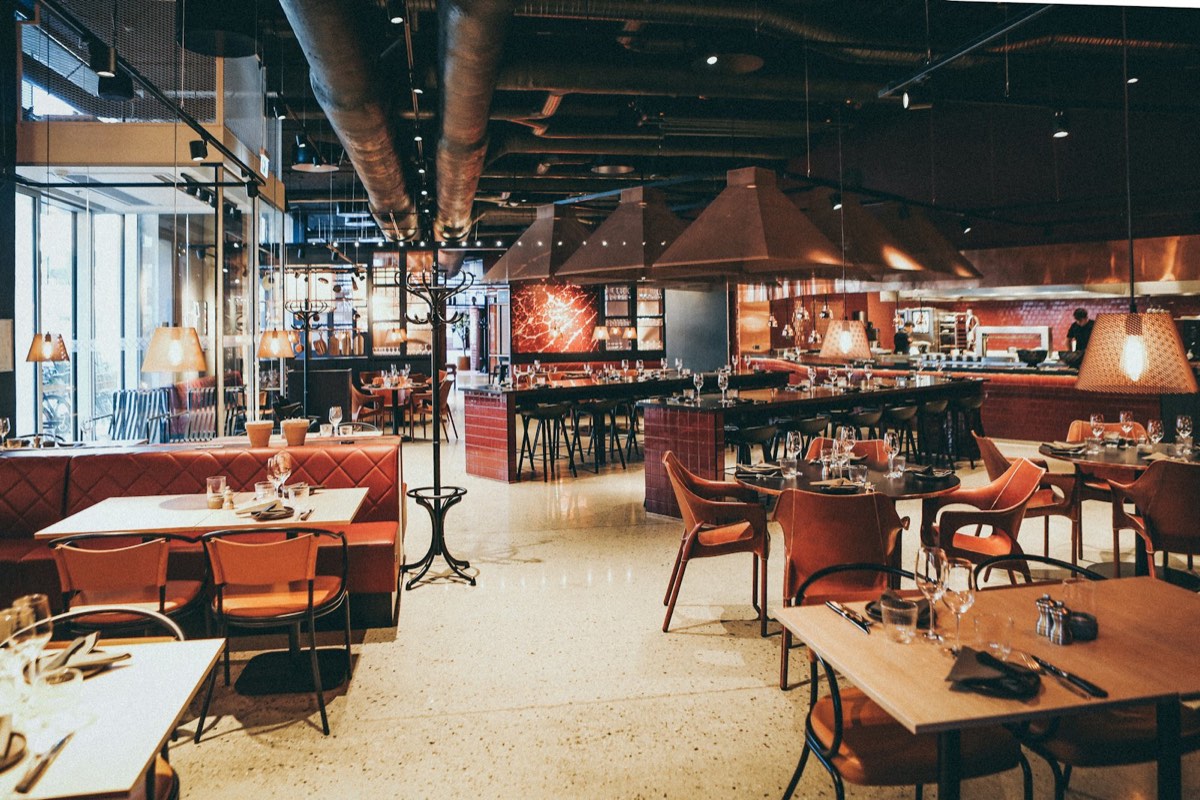
December 2023 to January 2024. Spend cut by more than half. Demo requests up 18%. Cost-per-demo down 63% against the program's own baseline. The kind of step-change that doesn't survive without a measurement layer to prove it's real — and that's what Phase 1 built.
Paid is the loud half. SEO is the compounding half — and on a B2B SaaS site selling into restaurant operators, the compounding has to be earned page by page.
We mapped 105 pages to a keyword strategy, rewrote metadata and H1s across 69 resource pages, categorized 112 pages for schema markup, and shipped a hub-and-spoke plan plus a keyword-gap roadmap. By March, the Resources section was holding 21 first-page rankings, with 27 more queries sitting on page two — the clearest kind of next-quarter growth runway an organic program can show.
Rankings landed on the queries that matter to operators: "5 steps to launching POS," "Opening Restaurant 90 Day Checklist," "importance of restaurant POS." Homepage caught permutations of "restaurant reservation system."

Every paid number in this case study survived a QA pass first. Some of them only exist because of one.
The LinkedIn Insight Tag's conversion ID was firing on pageview, not action — every page load was being counted as a B2B form submit. We caught it in GTM, isolated the misattached ID, and corrected the tracking. Cleaner numbers. Defensible reporting. A conversion count that finally matched a real lead-per-user ratio.
Same diligence on the GA4 side. Form-submit conversions had quietly fallen off after January 11 when the site moved to HubSpot forms — GTM triggers were still pointing at the old form structure. Fixed. Documented. Flagged for the team.
This is the work that doesn't show up in a dashboard. It's the work that makes the dashboard worth reading.

For B2B SaaS leaders selling into operators with no patience for noise — restaurants, hotels, regulated industries — the Tock engagement is the template.
It's the story of foundation before flash. CRM before campaigns. Attribution before optimization. Conversion-tracking QA before any number gets reported. Then — only then — the paid engine, tuned hard enough to drop cost-per-demo 63% in a single month and scale it from there.
Boutique team. Senior operators. Two phases, nine months, one engine.
iExcel runs the CRM implementation, the attribution layer, the paid engine, and the QA spine that makes every reported number defensible.
Book a 15-min sanity check →